



The Walt Disney Company delivered investors an undeniably strong set of theme-park numbers this week. But buried within those results is a statistic that becomes particularly interesting when placed alongside what guests have actually been seeing at Walt Disney World and Disneyland.
Disney says attendance at its domestic theme parks increased 3% year over year during its fiscal third quarter. Domestic Parks & Experiences revenue climbed to approximately $7.12 billion, up 11%, while operating income increased an impressive 27% to roughly $2.09 billion.
Those are excellent financial results. And the attendance number sounds pretty good, too.
READ: James Gunn Shuts Down Rumor That The Batman Part II and The Batman Part III Are Filming Back-to-Back
There’s just one very important catch when discussing what those numbers mean for the crowds people have been observing this summer:
July isn’t in them.
Disney reported its fiscal third-quarter results on August 5, 2026, but that doesn’t mean the attendance increase describes what was happening in the parks immediately before the earnings announcement.
The quarter ended June 27, 2026.
In practical terms, Disney’s Q3 attendance statistic covers approximately late March through late June — essentially April, May and June — compared with the corresponding period a year earlier. It does not cover July. And while Spring Break season was quite crowded this year at the parks, this summer has been a bummer for attendance.

The Haunted Mansion in Disney World’s Magic Kingdom behind a photo realistic scrim – X, @bioreconstruct
There’s another important qualification.
Disney’s reported 3% increase is for its domestic parks, rather than a standalone Walt Disney World attendance number.
That means the statistic encompasses Disney’s U.S. theme-park operations in Florida and California. Reporting on the earnings results describes attendance at Walt Disney World and Disneyland collectively as increasing 3%.
Disney does not tell investors in this metric exactly how many people entered Magic Kingdom, EPCOT, Hollywood Studios or Animal Kingdom, nor does it give us an attendance number for Disneyland Park versus Disney California Adventure.

Spaceship Earth and the EPCOT fountain – Photo Credit: Follow The Bradleys’ Fun
READ: Disney Orders Pilot for Spaceship Earth TV Show Based on EPCOT Attraction
That’s significant because it means outsiders can’t use the 3% figure to conclude that Walt Disney World itself was necessarily up exactly 3%.
Disney also defines attendance somewhat differently than a casual observer might assume. Its financial filings say attendance is based on unique daily entries. Someone visiting multiple theme parks during the same day may be counted twice. VIP events like Mickey’s Not So Scary Halloween will definitely be counted as additional attendance. Complimentary admissions are included, while children under three are excluded.
So Disney’s number is a legitimate operating metric — but it’s also a broad one. It’s one the average investor likely doesn’t understand.
Disney Tourist Blog reported on July 6 that Walt Disney World was experiencing what, at that point, was its slowest month since September 2021 based upon attraction wait times.
July 1 registered an average Walt Disney World attraction wait of about 30 minutes. The following days were 25 minutes or less.
Then came July 5.
The resort-wide average reportedly fell to just 19 minutes.
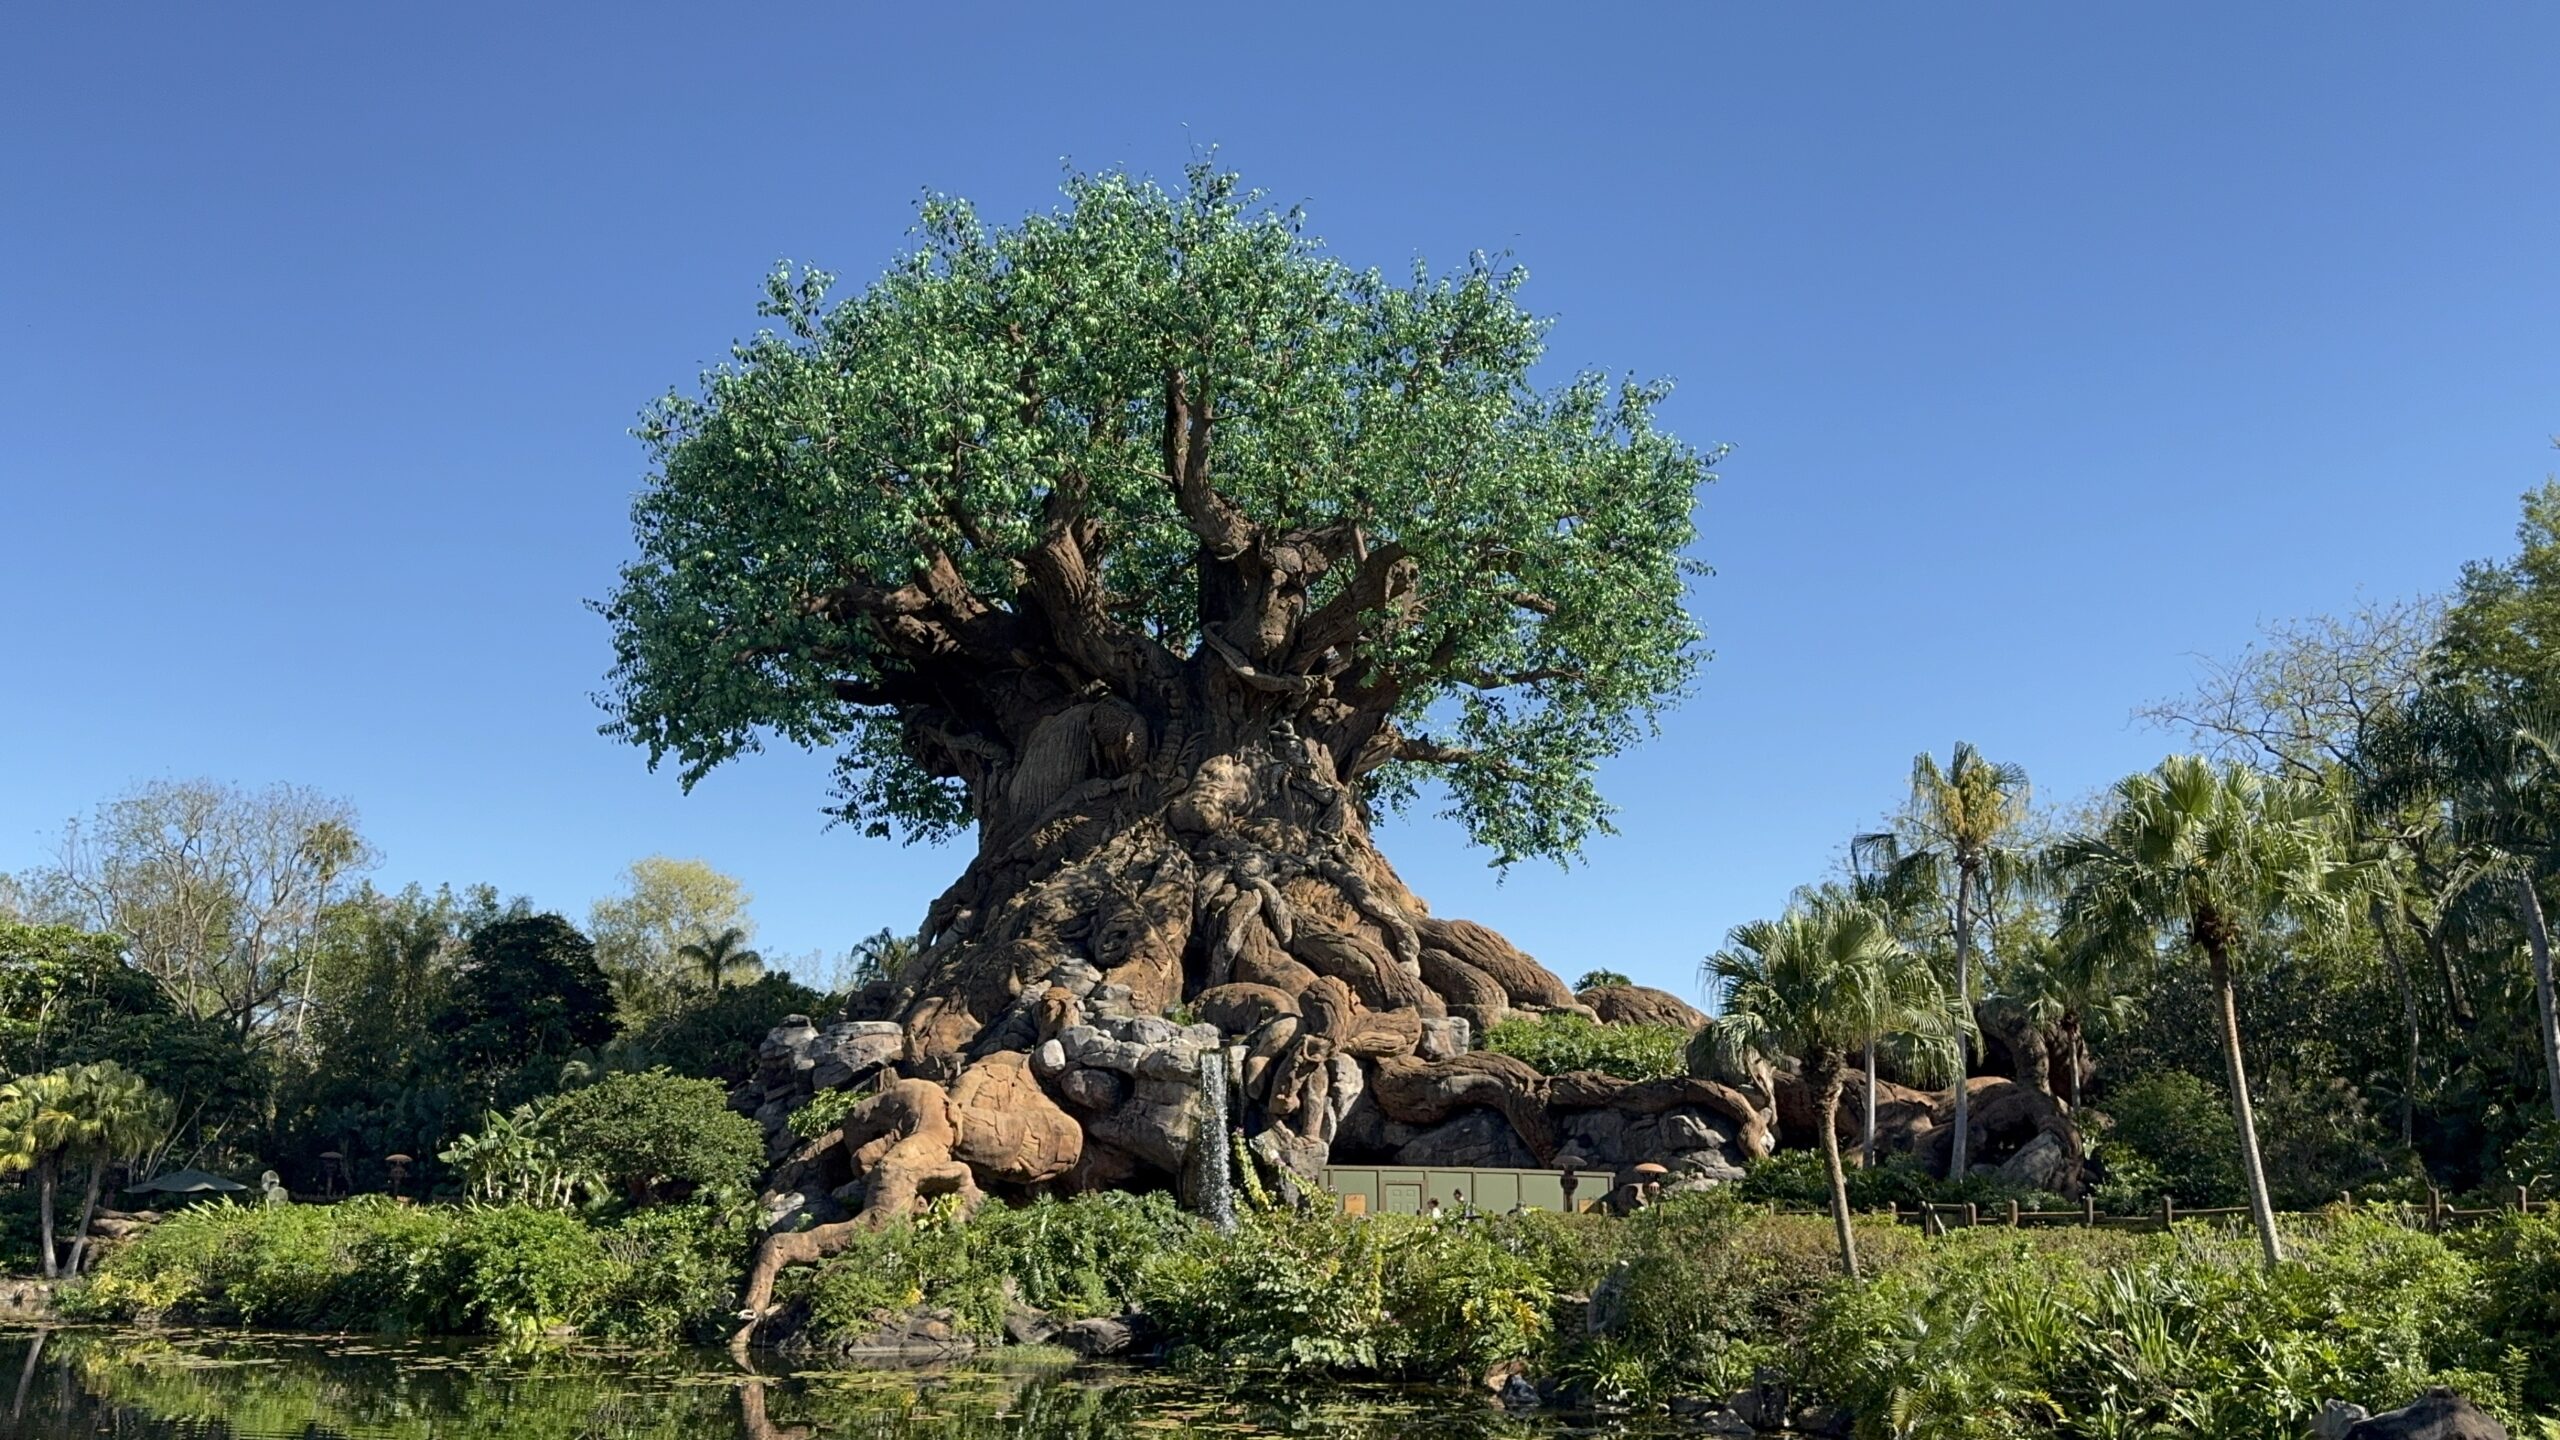
The Tree of Life in Disney’s Animal Kingdom in Walt Disney World – Photo Credit M. Montanaro
That made July 5 the lowest-wait day of 2026 to that point and the lowest since October of the previous year, with only a handful of days during the previous August and September coming in lower over the longer comparison period.
Even the Fourth of July holiday produced some extraordinary results.
Disney’s Hollywood Studios reportedly averaged only about 20 minutes on July 4, while both Hollywood Studios and Animal Kingdom recorded their lowest wait times of the year at that point. EPCOT was a notable exception, unsurprisingly benefiting from its Independence Day fireworks programming.
The weakness wasn’t entirely new to July, either.
Ahead of the month, analysis of the numbers showed June had already become the slowest month of 2026 at Walt Disney World, with average waits approximately two minutes below May and three minutes below June 2025.
By the end of July, TouringPlans was recording extraordinarily low crowd levels. On July 30, its Walt Disney World resort-wide crowd level was just 3 out of 10. Magic Kingdom registered 2/10, EPCOT 1/10, Hollywood Studios 3/10 and Animal Kingdom 4/10. July 31 was similarly weak, with an overall 3/10 and EPCOT at only 1/10.
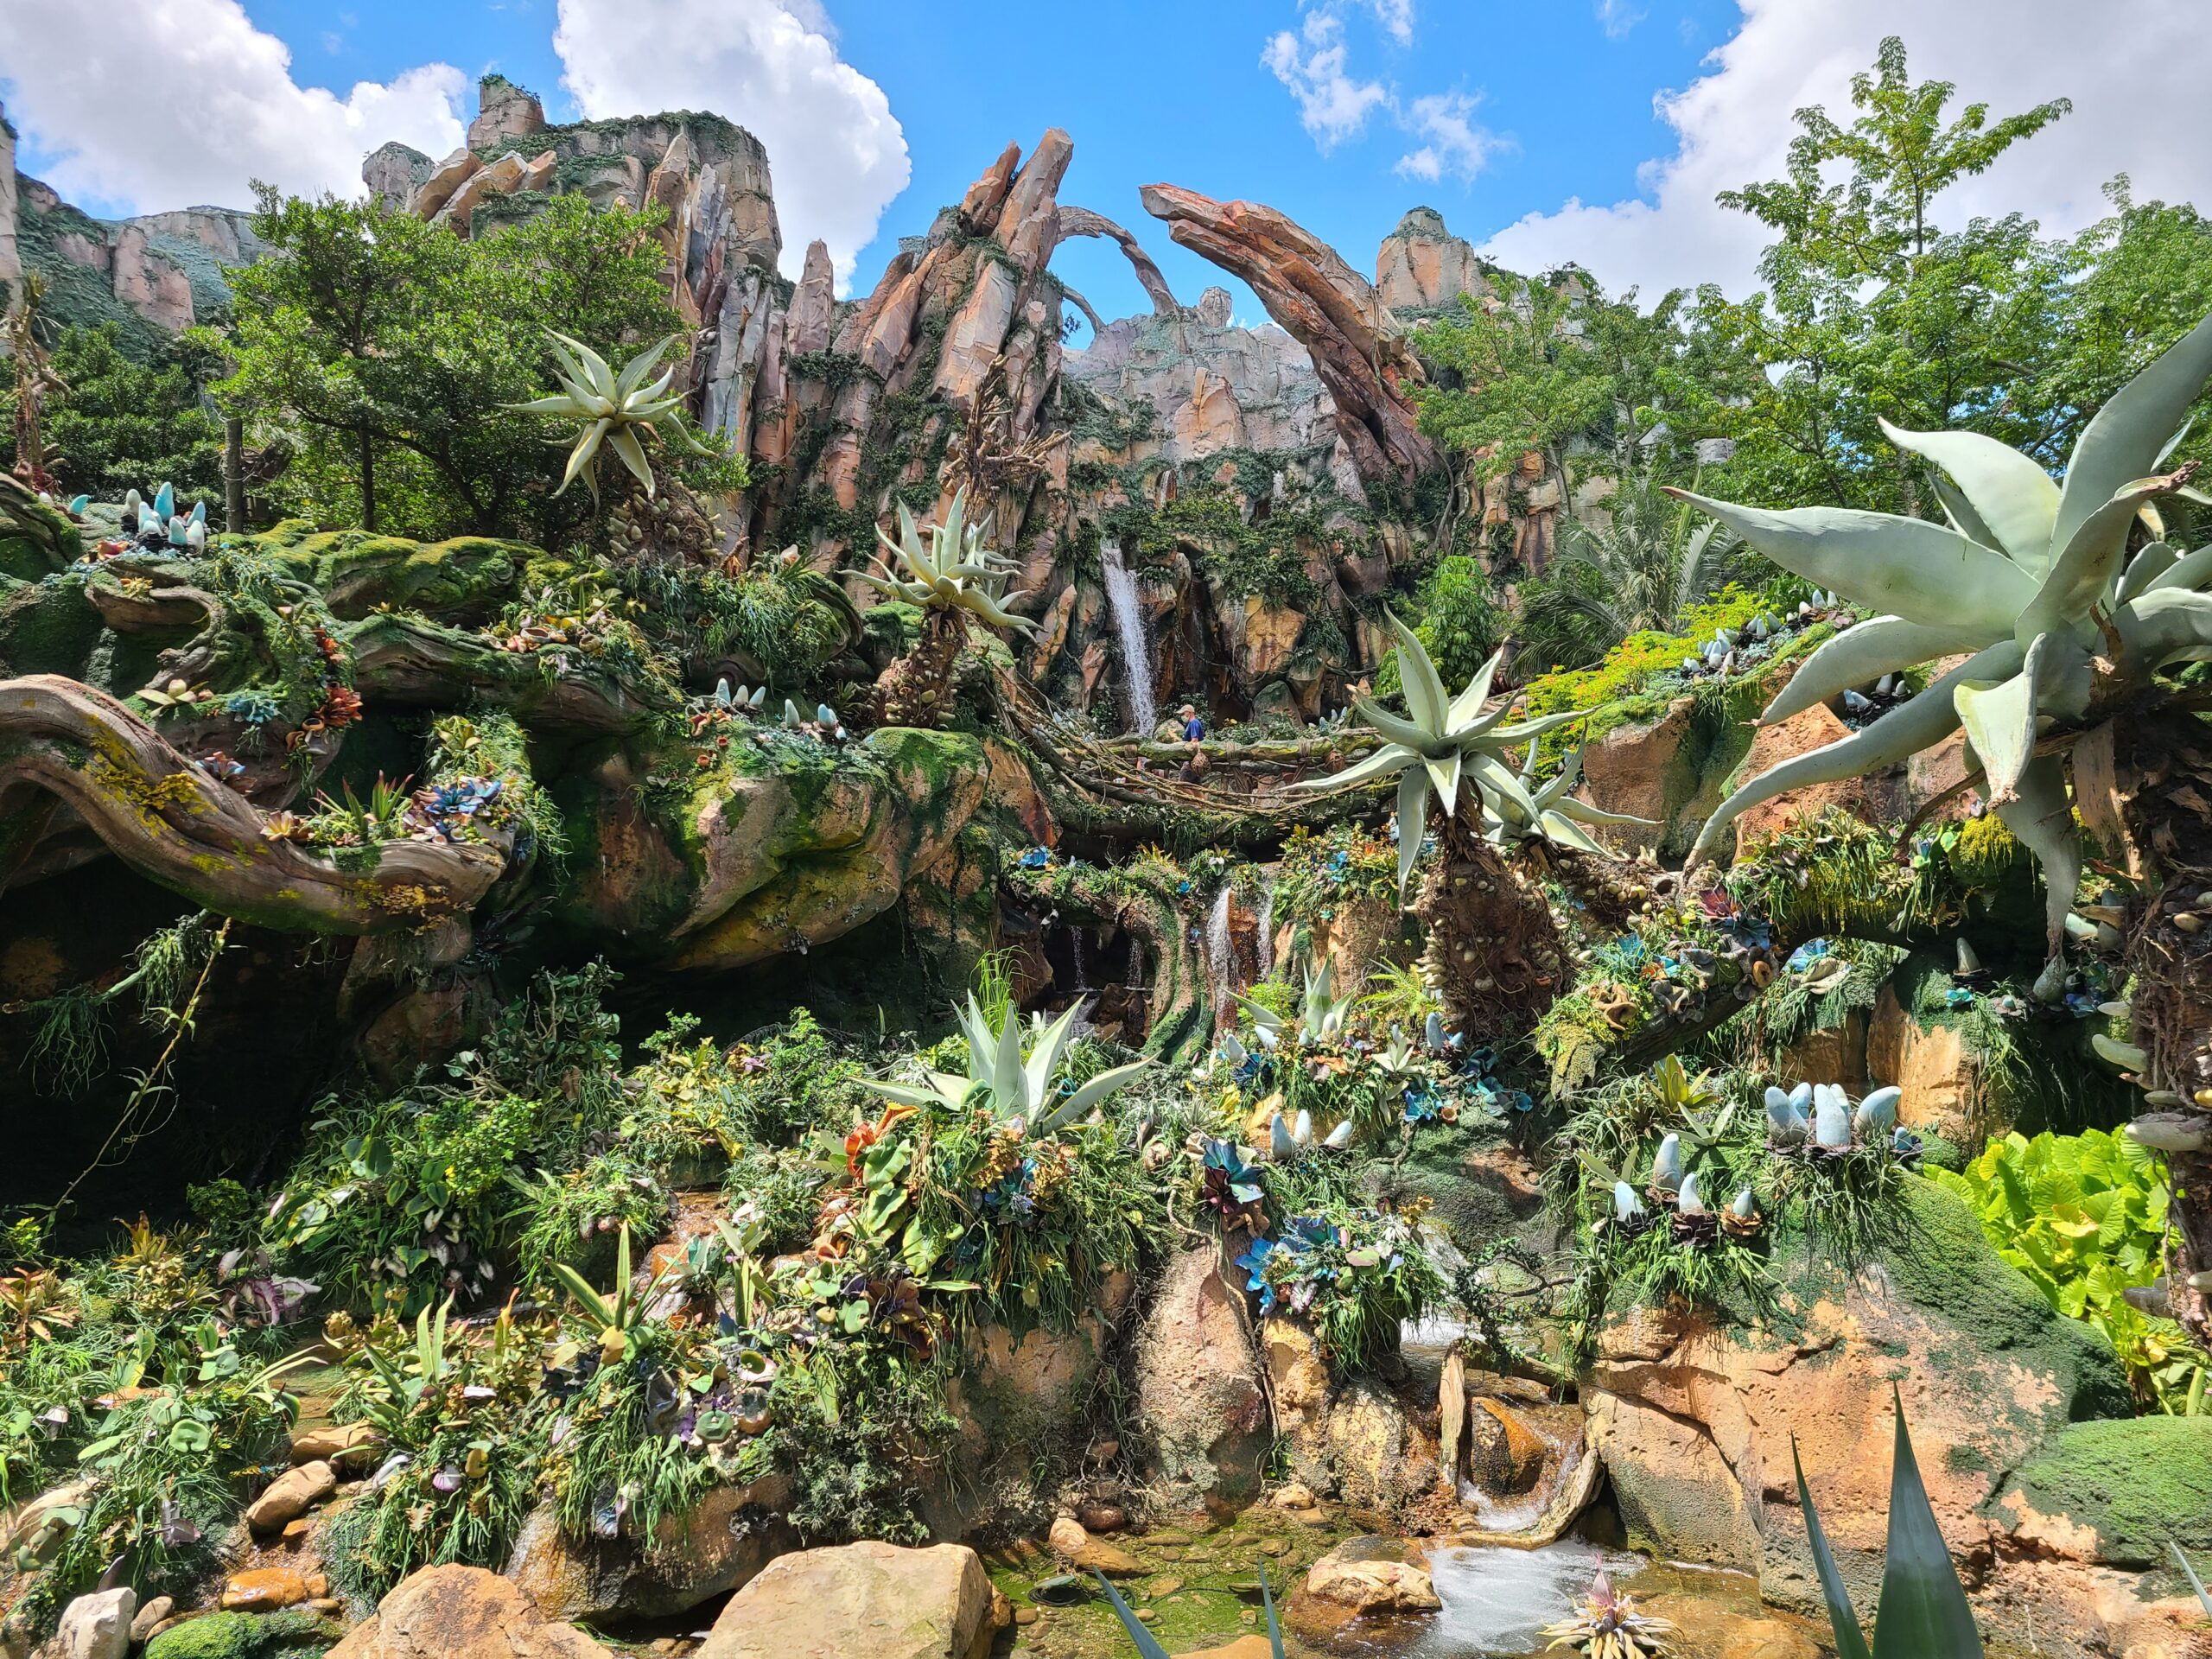
The World of Pandora in Disney’s Animal Kingdom at Walt Disney World – Photo Credit: That Park Place
For anyone accustomed to the old image of summer at Walt Disney World — packed walkways, hour-plus attraction queues and enormous Independence Day crowds — these are striking figures.
Disneyland Was Showing Similar Warning Signs
Florida wasn’t the only place where guests noticed something unusual.
Disneyland visitors were openly discussing surprisingly light crowds going into July. In one community discussion from late June, guests remarked on unusually short lines, with explanations ranging from summer Magic Key blockouts to the World Cup and the rising cost of visiting the resort.
The Fourth of July produced some particularly remarkable anecdotes at Disney California Adventure. Guests reported Incredicoaster waits around 10 minutes and Guardians of the Galaxy reaching a posted wait of only about 13 minutes at one point.
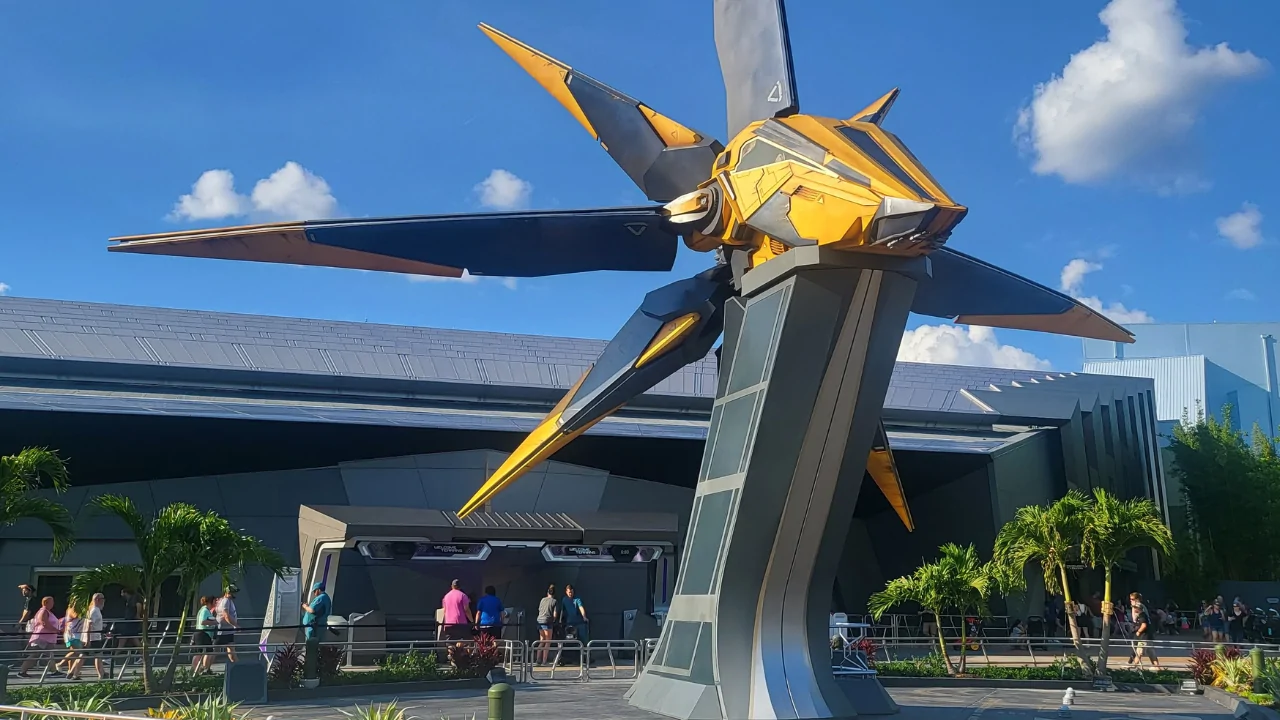
The Exterior of Guardians of the Galaxy Cosmic Rewind in EPCOT at Walt Disney World – Photo Credit: That Park Place
Another guest described the July 3-5 holiday trip as unexpectedly uncrowded, reporting extremely short waits and enough available attraction capacity to accomplish substantially more than expected.
These anecdotes aren’t equivalent to audited attendance figures, of course.
But when anecdotes begin lining up with independently collected attraction wait-time data, they become harder simply to dismiss as perception.
Disney announced that attendance increased 3% during a quarter that ended before July began!
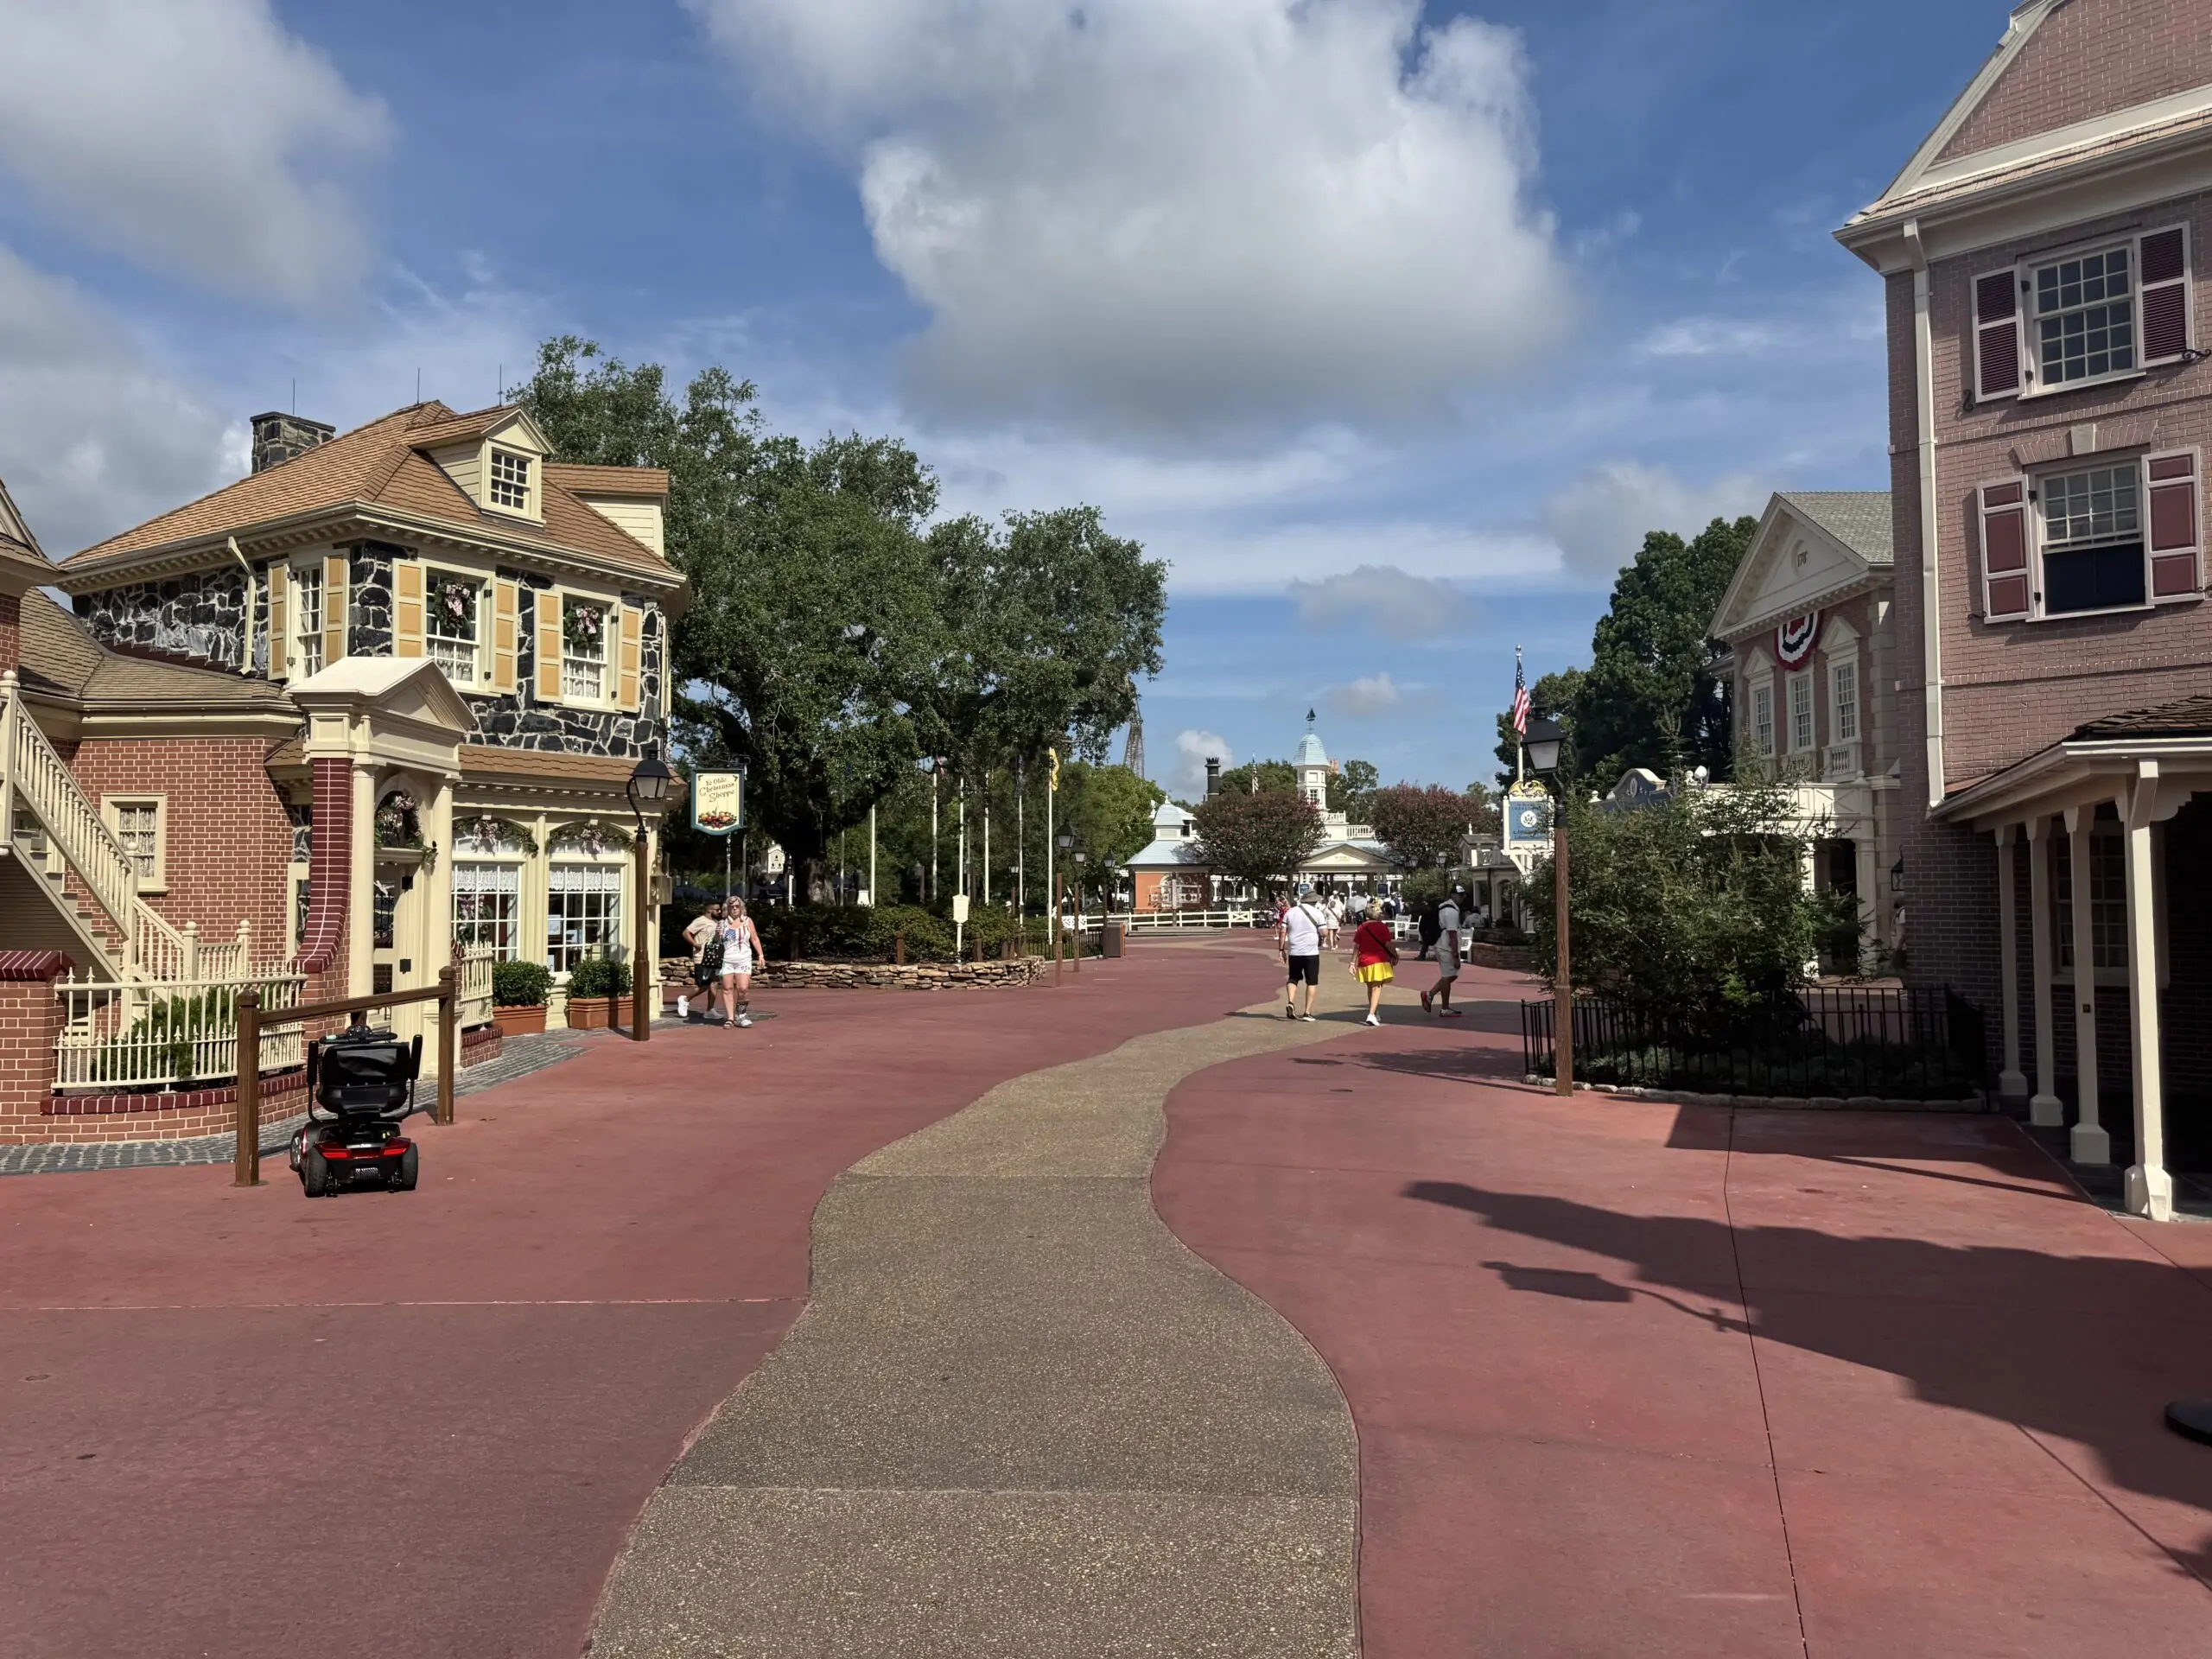
Liberty Square sits nearly empty on July 4, 2025 – Photo Credit: That Park Place
And almost immediately after that measurement period closed, Walt Disney World’s wait-time data started producing some of the lowest summer crowd readings we’ve seen in years.
That doesn’t prove Disney’s attendance statistic is inaccurate.
It does, however, create a fascinating question for the current quarter:
Did Disney’s domestic parks continue their Q3 attendance growth into July — or did the crowds fall off a cliff just after the quarter closed?
The next set of numbers may tell us considerably more. Or after hours events may just hide a decline most people can see for themselves.
What’s your opinion on Disney World attendance? Sound off and let us know!
UP NEXT: Xbox Source Says No Full-Time Staff Were Laid Off at Halo Studios, Only Contractors
