

The media narrative surrounding the Super Bowl LX halftime show has been immediate and sweeping: record audiences, historic reach, and another cultural milestone for the NFL’s mid-game spectacle. Headlined by global music star Bad Bunny, early projections suggest the Halftime Show viewership may have reached more than 135 million viewers, placing it among — or potentially at the top of — the most-watched halftime shows in Super Bowl history.
But as with many modern ratings debates, the deeper you dig into the measurement systems behind those numbers, the more complicated the story becomes.
Competing Ratings Narratives
National viewership projections — typically modeled using Nielsen data — attempt to estimate the total number of people who watched across all platforms.
That includes:
- Traditional broadcast television
- Streaming platforms
- Mobile devices
- Out-of-home viewing (bars, parties, public venues)
- Co-viewing audiences

Bad Bunny performing at the Super Bowl Halftime Show – YouTube, NFL
READ: Amazon’s God of War Series Reveals Callum Vinson as Kratos’ Son Atreus
Under that framework, the Bad Bunny halftime show appears to have delivered massive reach, continuing the Super Bowl’s trajectory as America’s most dominant television event.
However, third-party analytics firm Samba TV measures something very different and shows a far less rosy picture.
Instead of projecting total viewers, Samba tracks TV households using Automatic Content Recognition technology — measuring what is physically being watched on television screens in real time with no guess work.
That methodological divide is where the ratings narrative begins to split.
A Three-Year Household Slide
When measured strictly by Samba’s smart-TV household data — using the same criteria year over year — halftime show retention has declined across the last three Super Bowls.
#SuperBowlLX delivered another massive night of television and the data tells an interesting story.
Our latest viewership insights reveal:
📺 48.6M U.S. households tuned in to #SuperBowl LX, representing a 13% decrease from last year’s game
🎵 26.5M U.S. households watched… pic.twitter.com/TnZ7pIU75H— Samba TV (@samba_tv) February 9, 2026
According to Samba’s household measurement:
- 2024 — Usher: 30.1 million households
- 2025 — Kendrick Lamar: 28.8 million households
- 2026 — Bad Bunny: 26.5 million households
That represents a three-year drop of roughly 3.6 million households, or about a 12% decline in in-home halftime engagement.
While national projections highlight growth, the smart-TV dataset suggests erosion.
The #Usher #SuperBowl Halftime Show was a hit with fans. 30.1M US households watched that #AliciaKeys moment, #Ludacris and #LilJohn bringing it back for millennials everywhere, and ofc who could forget the skates. Sure, #Bieber wasn’t up there, but we still loved it.… pic.twitter.com/xJRJ2F0YkR
— Samba TV (@samba_tv) February 12, 2024
Both can technically be true — but they tell very different stories about audience behavior.
The Halftime Retention Gap
Samba’s broader Super Bowl LX data adds another layer to the conversation.
Within the same smart-TV measurement ecosystem:
- 48.6 million households watched the game overall
- 26.5 million households remained for halftime
That implies more than 22 million households tuned out before or during the halftime performance.
Bad Bunny delivers a monologue on SNL – YouTube, Saturday Night Live
READ: The Mandalorian and Grogu Super Bowl Spot Was a Monumental — and Expensive — Marketing Fumble
Whether viewers switched platforms, watched on mobile, or simply lost interest — the retention gap is significant when measured strictly through television screens.
Samba vs. Nielsen: Screens vs. People
Understanding the halftime ratings debate requires understanding the difference in measurement models.
Samba TV measures:
- In-home smart TV screens
- Streaming via connected television apps
It does not measure:
- Phones or tablets
- Laptops
- Out-of-home viewing
- Group co-viewing environments
Nielsen-modeled projections attempt to estimate:
- Total people watching
- Cross-platform reach
- Public venue audiences
In simple terms: Samba directly measures screens while Nielsen estimates people.
The Bigger Media Framing Question
Which dataset gets amplified often shapes the public narrative.
Record-setting projections create headlines about cultural dominance and mass appeal. Household retention declines raise questions about engagement. Both rely on legitimate measurement systems — but each highlights different aspects of audience behavior.
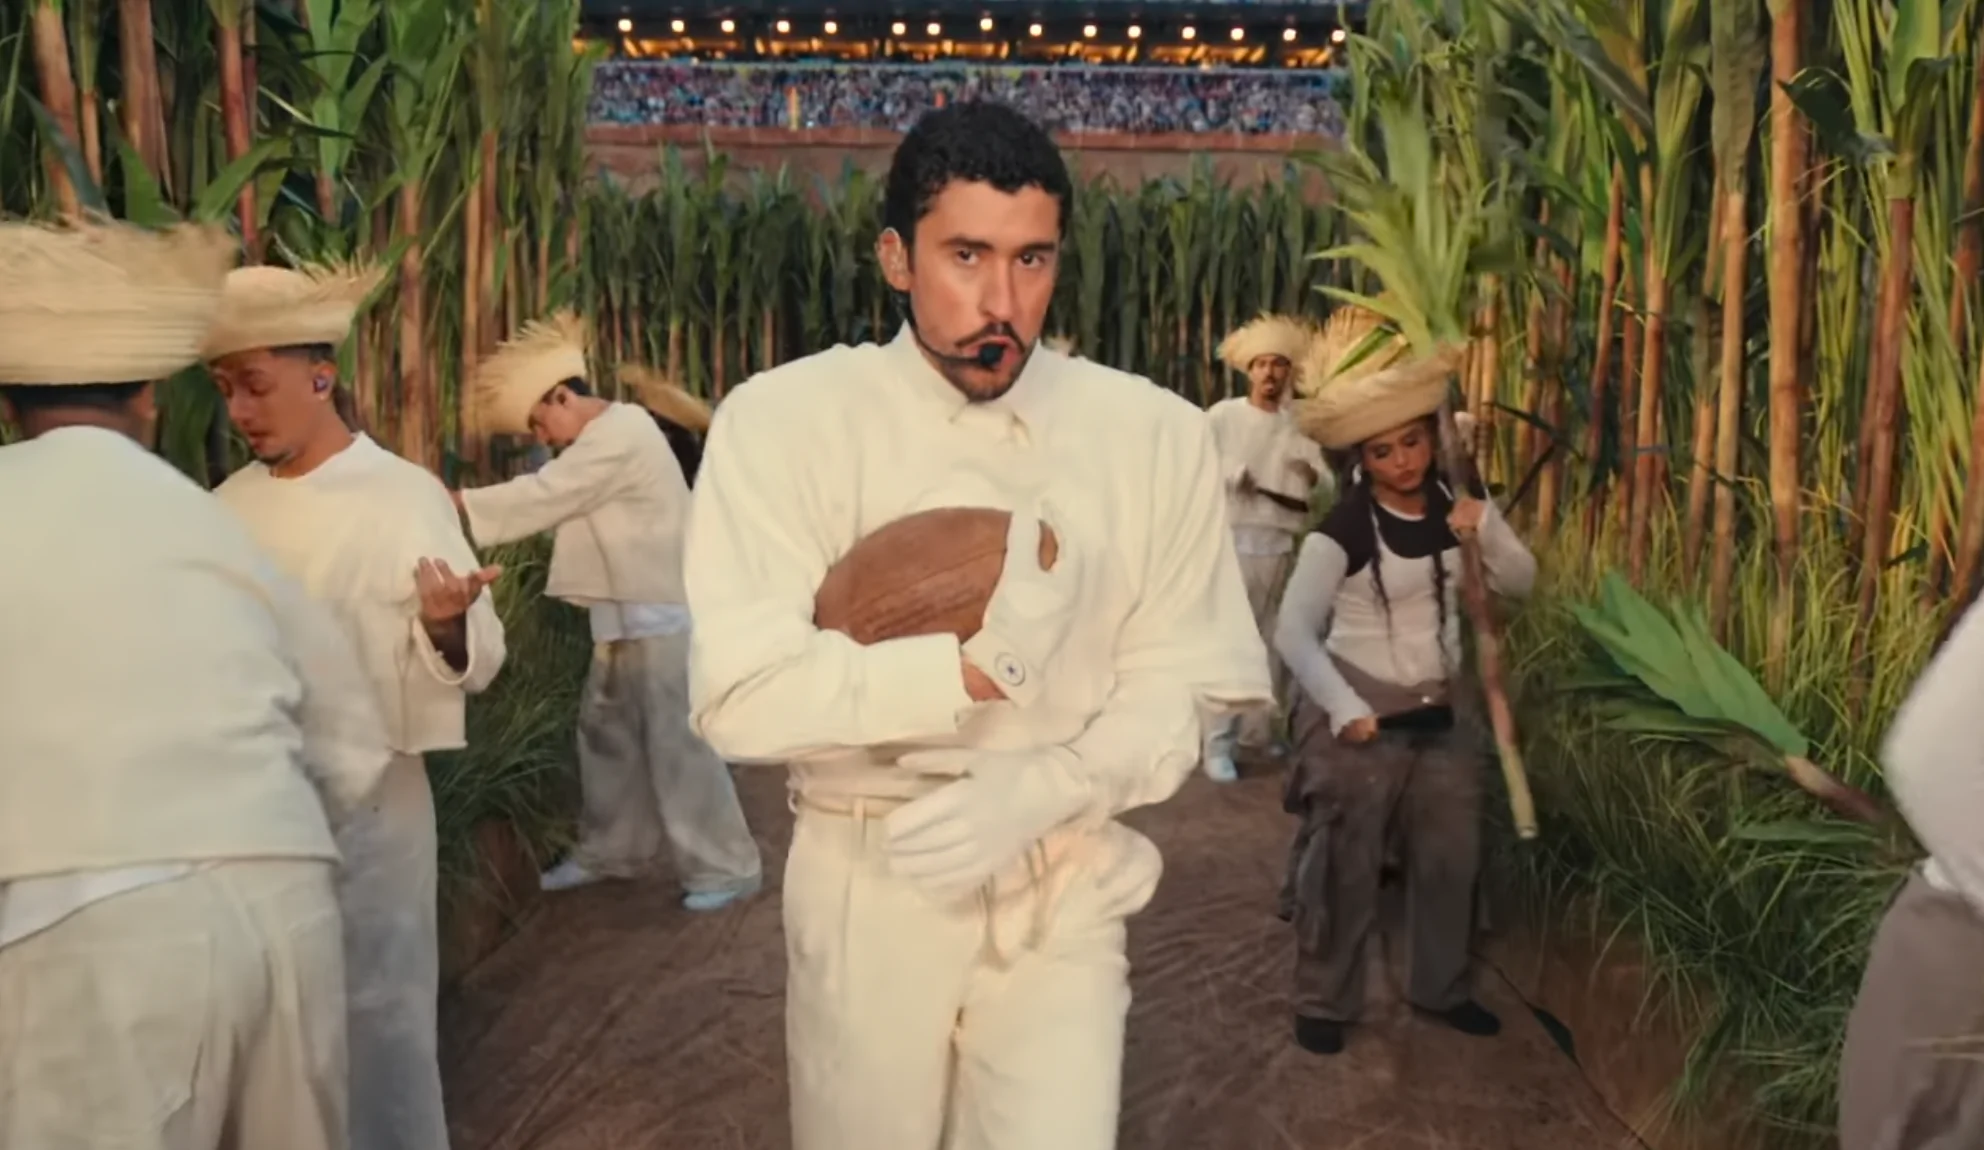
Bad Bunny performs at the Super Bowl Halftime Show – YouTube, NFL
And depending on which metric is spotlighted, the halftime story shifts dramatically.
But within smart-TV household measurement, the trajectory across recent years is clear: 30.1M to 28.8M to 26.5M
A multi-year slide in in-home halftime retention — even as total cross-platform viewership headlines continue climbing.

Bad Bunny performs the halftime show at the Super Bowl – YouTube, NFL
In today’s fragmented media environment, ratings debates are no longer about one number. They’re about which numbers get promoted — and which get ignored.
Do you think the Bad Bunny halftime show viewership fell, as Samba TV reports? Sound off in the comments and let us know!
UP NEXT: Gay Days Event at Disney World Paused for 2026 Amid Sponsorship Loss and Event Challenges